Branch Out with GIS: Teens Take on Tree Mapping
From GIS Novices to GIS Experts
During the second week of our Green Valley Summer Program, students were introduced to the fascinating world of Geographic Information Systems (GIS)!
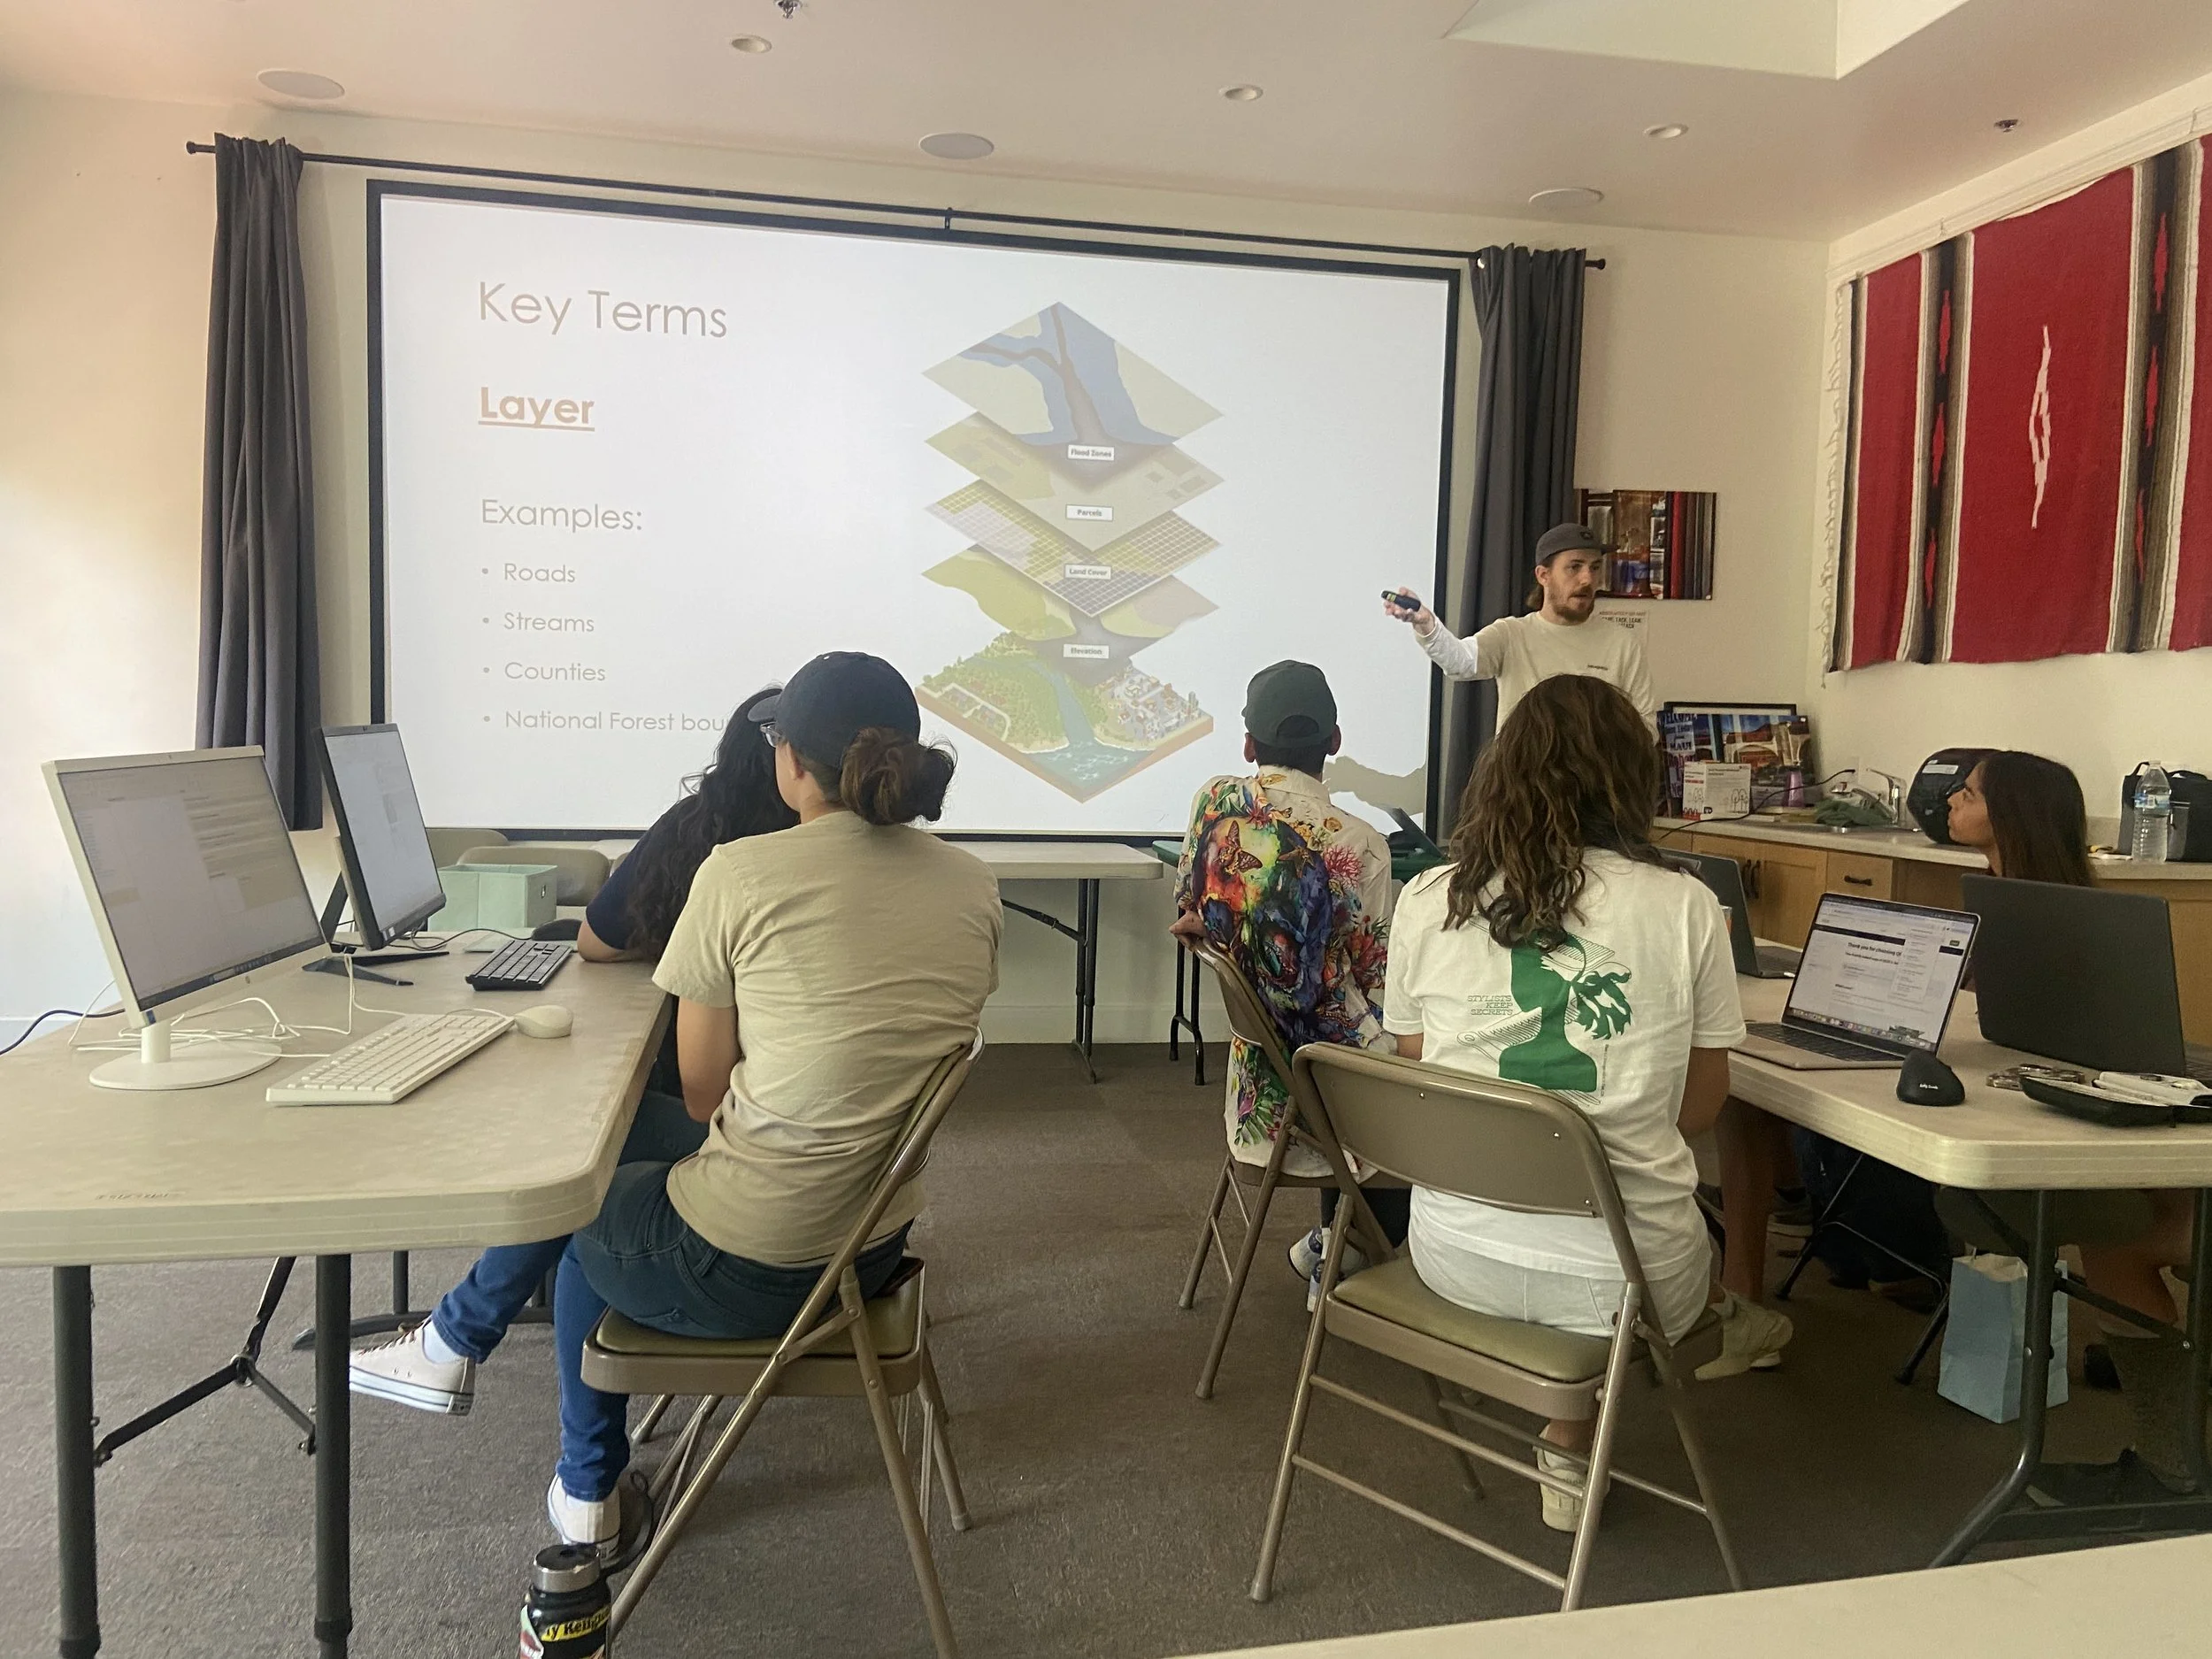
Bryant Baker, a GIS expert from Los Padres Forest Watch, led a two-day workshop for our students, where they used historical tree data to create a map of trees planted by the Green Valley Project.
Throughout the workshop, our students faced several challenges, as many had no prior experience with GIS. However, with Bryant's guidance, our students progressed from GIS beginners to GIS pros!
Exploring the Process: Challenges and Successes
The students' GIS journey began with Bryant introducing them to the fundamentals, including the differences between vector and raster data. Despite being new to GIS, the students were eager and intrigued to explore the world of GIS.
After covering the basics, it was time for the students to create their own maps! Although they initially struggled with navigating the complex GIS software, they approached the challenge with enthusiasm and determination.

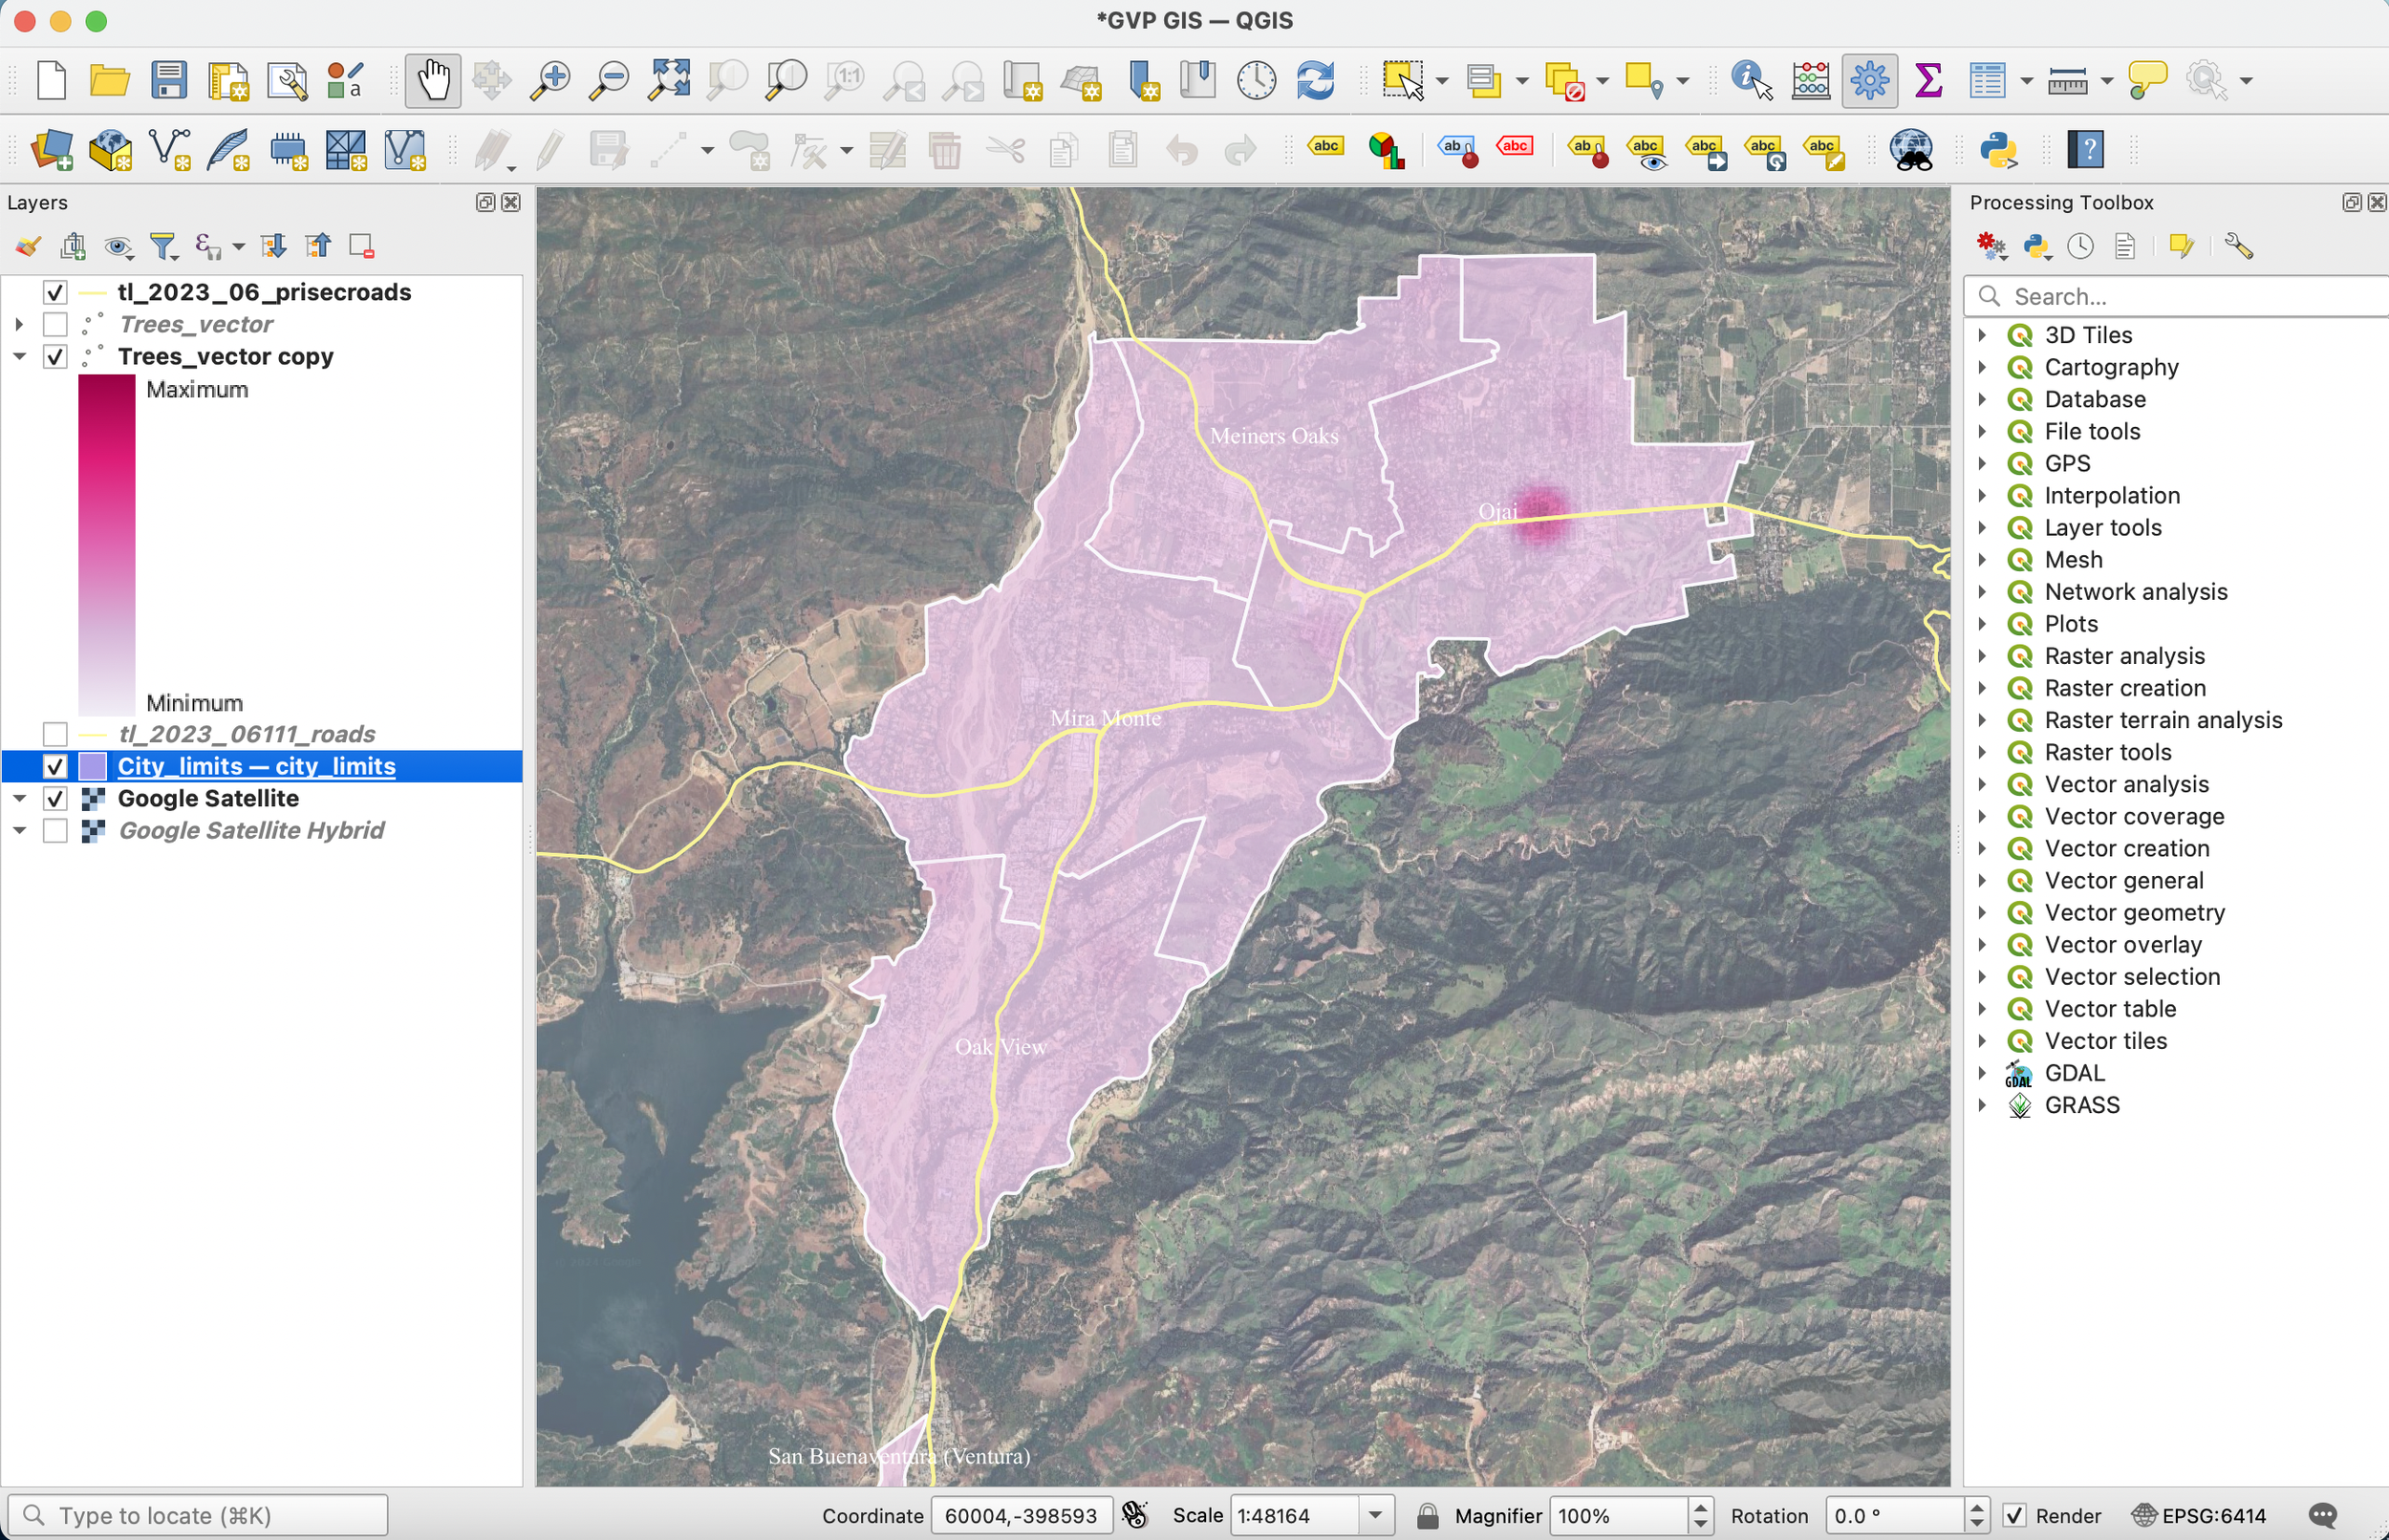
The students were assigned to create a map to plot all 59 trees planted by the Green Valley Project. They began by adding a "base layer" of California, then zoomed in on Ojai to focus their map. To refine their map, they incorporated additional layers to highlight city limits, resulting in the final map displayed below.

After creating the "base map" of Ojai, the students needed to input the tree data into the GIS software and use it to plot the trees on the map.
Entering the data into the GIS software was tricky for many students, as it is meticulous and tedious work. Even minor errors, such as an extra space or misplaced period, could prevent the data from appearing on the map. Despite these difficulties, the students persevered and successfully completed their plotting, resulting in the map shown below!

Due to the students completing the difficult steps with ease, Bryant decided to further challenge the students by giving them the task of creating a “hot spot layer.” This layer would highlight areas with the highest concentration of trees, revealing “cold” spots where the Green Valley Project should focus future planting efforts.
To create the “hot spot layer,” the students had to utilize several GIS tools, which required precision, attention, and patience! Despite the complexity of this task, the students approached it with enthusiasm and successfully completed it. At the end of the GIS workshop, the students not only created a beautiful, impressive map, but they left feeling like GIS experts.
Below is the final map created: which highlights tree “hot” and “cold” spots!